Zack Strathe
M.S. Data Analytics
at Kansas State University
• Data Science Program Track
• Graduated August 2022
• GPA: 4.0

View My LinkedIn Profile
View My Github Profile
Project Portfolio
Satellite Image Feature Extraction & Classification Using PySpark
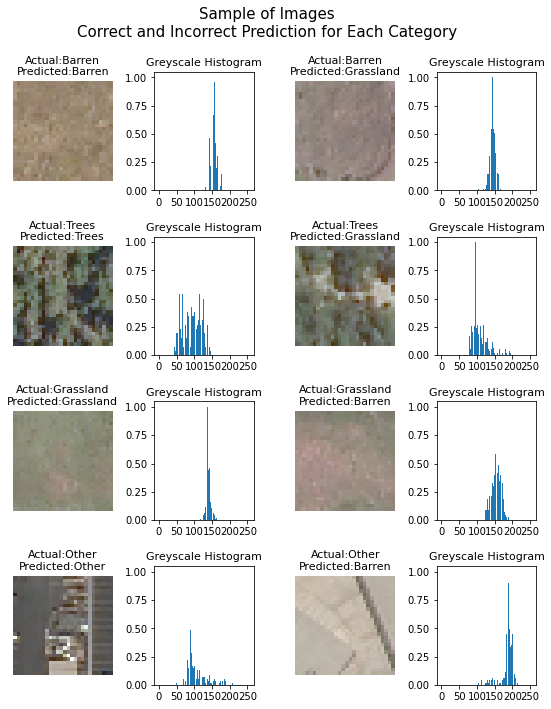
Term Project for CIS 731: Programming Techniques for Data Science and Analytics- Entirely using the Apache Spark/PySpark distributed computing framework in Python, evaluated methods of feature extraction and compared performance of classification algorithms with a gigabyte-scale data set of 500,000 labeled satellite images, with the goal of developing a model to accurately predict land classes (forested, grassland, barren, other)
- Utilized a weighted F1 score (the harmonic mean of precision and recall) for evaluation, which helped to account for class imbalance in the model training data
- To validate evaluation results, created a custom implementation within PySpark of 10-fold cross validation with a paired t-test
- Joined original image data with the transformed image data and classification results and exported for visualization with Matplotlib
- Deployed a Spark cluster on Amazon Web Services EMR to test real-world functionality and evaluate the processing time reduction from applied distributed computing; utilized a Google Cloud Platform virtual machine with a 16-core vCPU and 64 GB RAM for development and evaluation (to save on costs of running a real Spark cluster)
- Result: Improved weighted-F1 score from baseline of 81% to 93% by transforming images into a greyscale histogram and utilizing the logistic regression classifier algorithm
- Technologies used:
PySpark, Python, MLlib, OpenCV, NumPy, SciPy, Matplotlib, AWS EMR, GCP
Training a Proximal Policy Optimization (PPO) Deep Reinforcement Learning Model to Play Mario Bros
Term Project for CIS 730: Principles of Artificial Intelligence- Trained a deep reinforcement learning model to play the game Mario Bros, using OpenAI's Gym framework in Python, and evaluated methods of improving the trained Proximal Policy Optimization (PPO) model with modifications to the state-space, the action-space, and the reward function
- Developed and trained utilizing a Google Cloud Platform virtual machine with a 8-core vCPU and a Tesla T4 GPU
- Result: Developed a model that was able to efficiently complete the first level of Mario Bros after training to 20m timesteps
- Technologies used:
Python, OpenAI Gym Retro, OpenAI Baselines, TensorFlow, GCP
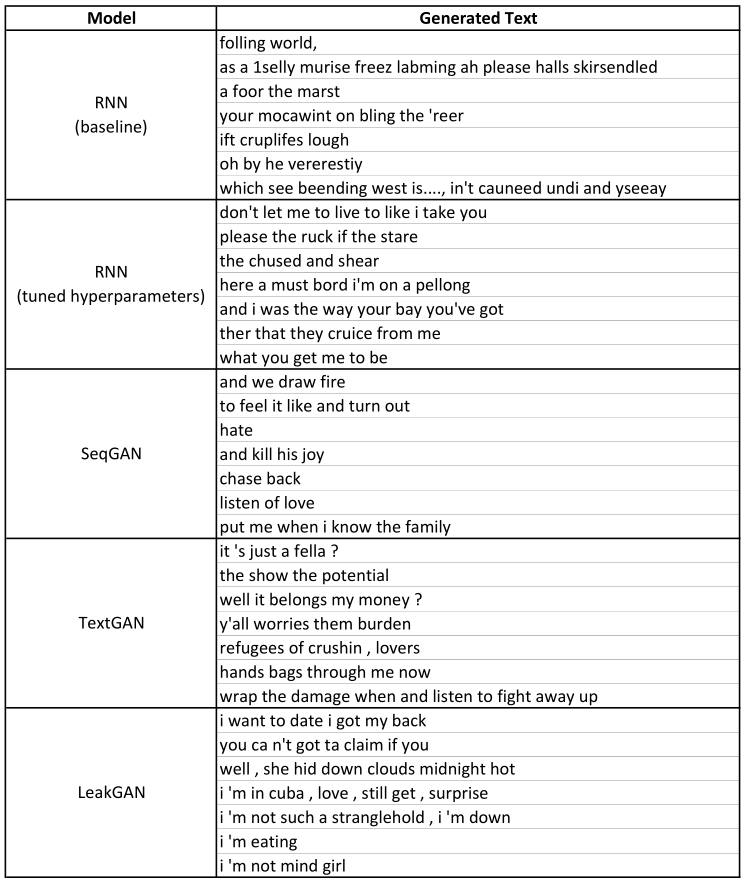
Comparison of Deep Learning Text Generation Models Trained with Song Lyrics
Term Project for CIS 732: Machine Learning and Pattern Recognition- Trained unconditional text generation language models from a text corpus of song lyrics, utilizing recurrent neural networks (RNNs) and generative adversarial networks (GANs) in Python with the PyTorch deep learning framework, and evaluated text output by utilizing a combination of human scoring and a computed bilingual evaluation understudy (BLEU) score
- Developed and evaluated utilizing a free Google Colab instance with a GPU
- Result: the trained SeqGAN model was evaluated the highest; however, the overall text generation seemed to generally lack quality and coherence compared to genuine song lyrics, indicating that significant future work could be undertaken to improve model output
- Technologies used:
Python, PyTorch
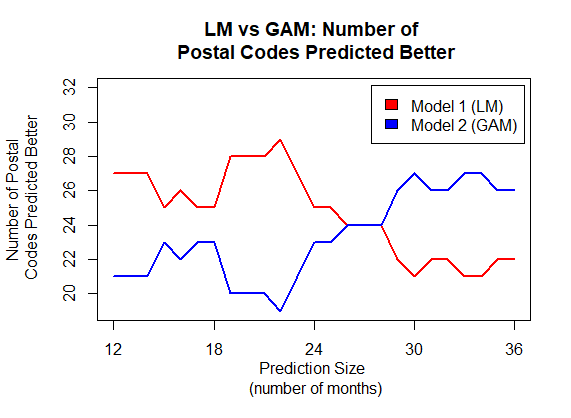
Statistical Analysis of Home Pricing with Linear Modeling in R
Term Project for STAT 705: Regression and Analysis of Variance- Created a linear model in R to conduct statistical analysis of home pricing in Kansas City, MO, and evaluated the linear model compared to a more-complex generalized additive model (GAM) for predictive performance
- Result: the simple linear model outperformed for short and medium-term price predictions (≤28 months), and the GAM performed better for longer-term price predictions (>28 months and ≤36 months)
- Technologies used:
R, ggplot2
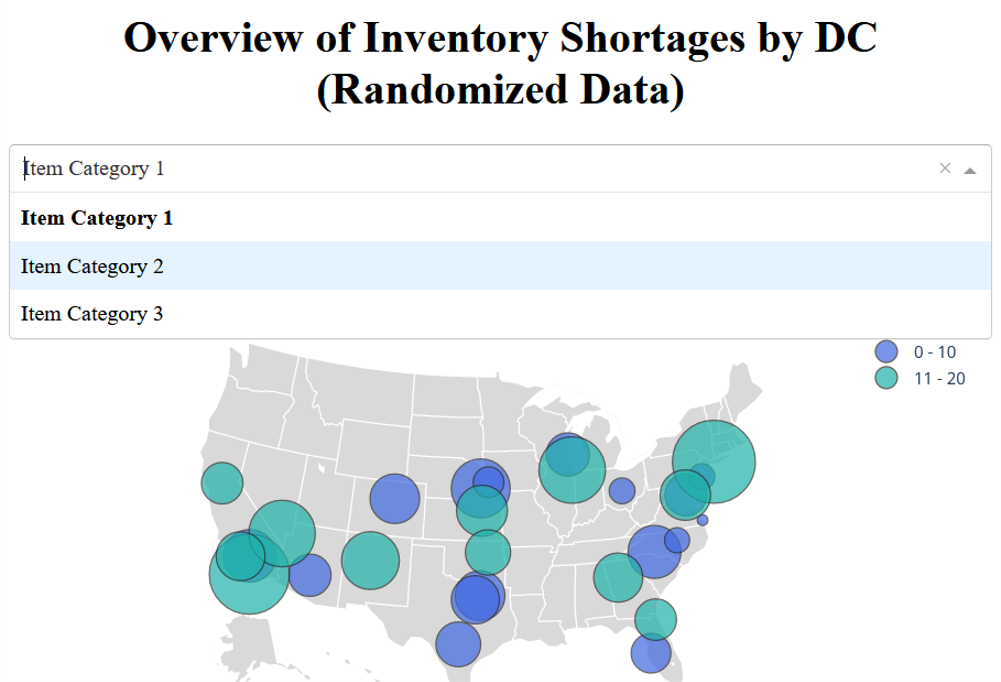
Business Capstone Data Visualization Project
Term Project for GENBA 890: Business Capstone- Coordinated student team in consulting with a client company to provide research findings into data visualization methods, and developed visualization dashboard implementations that provide greater insight into the status of their nationwide supply chain, utilizing both Python and PowerBI
- I can't share the deliverables due to confidential data used in this project; however, the presentation slides linked below are a summary that was presented at the K-State College of Business Graduate School Advisory Council Meeting on May 4th, 2022, which includes randomized data used in the examples of recommended visualizations
- Technologies used:
Python, Plotly/Dash
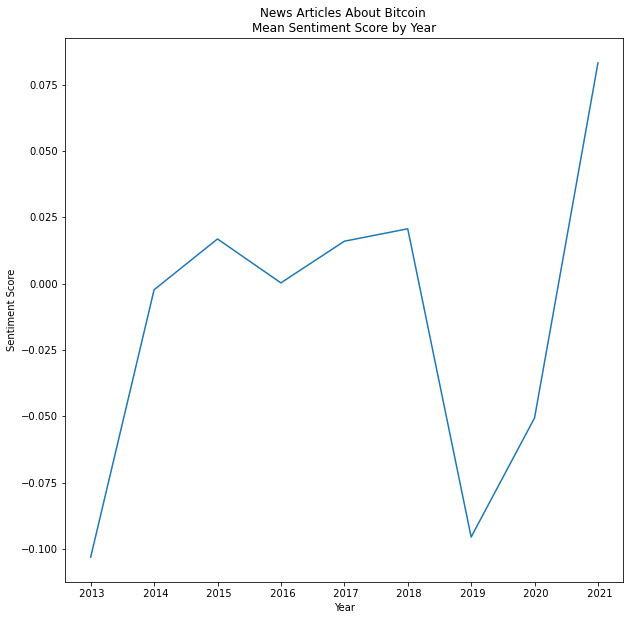
Web Scraping News & Twitter Sentiment Analysis of Bitcoin
Term Project for MIS 670: Social Media Analytics and Web Mining- Utilized web scraping with Python to collect news articles and historical price information about Bitcoin, and performed sentiment analysis on news articles to calculate the average aggregate sentiment per year to compare with annual Bitcoin price changes. Also utilized the Twitter API to collect and process tweets about Bitcoin to perform further sentiment analysis and network analytics
- Result: by comparing graphs of the annual Bitcoin price changes and the annual aggregate news sentiment about Bitcoin, there appeared to be some correlation between the two, though with sentiment lagging behind price changes by about a year
- Technologies used:
Python, Pandas, Natural Language Toolkit (NLTK), NumPy, Matplotlib
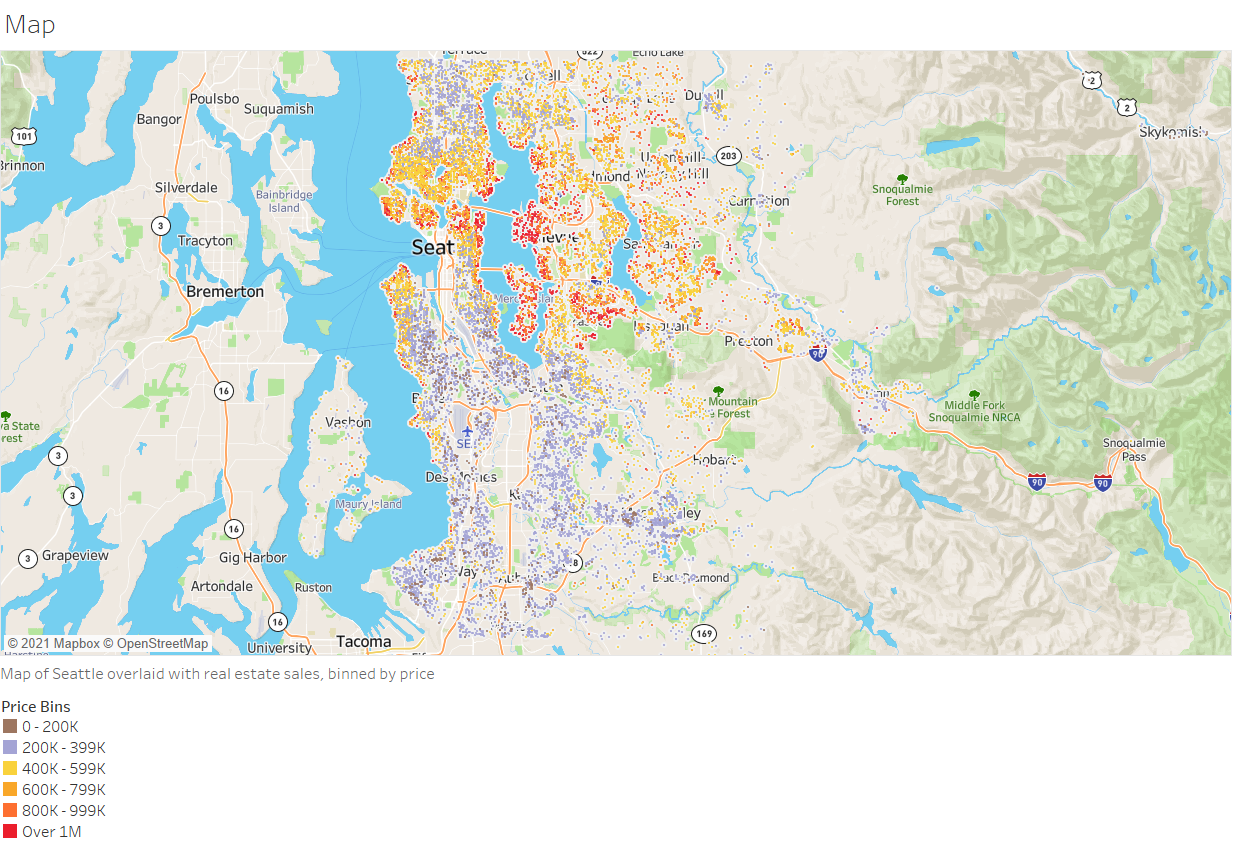
Real Estate Data Visualization with Tableau
Term Project for MANGT 830: Information Technology Strategy and Application- Analyzed residential real estate in Seattle, WA with a combination of visualizations developed in Tableau, utilizing a data set containing property prices and additional feature details for 21,000 properties
- Technologies used:
Tableau
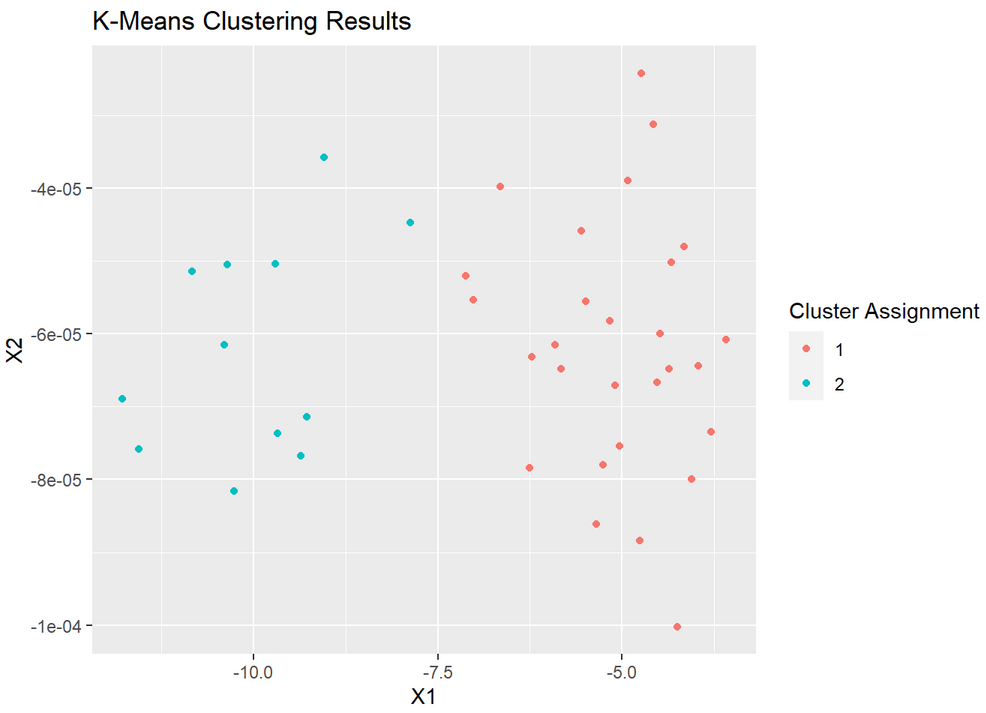
R Market Analysis
Term Project for MKTG 880: Applied Marketing Analytics- Conducted customer and market analysis for a fictional new chain of hotels
- Utilized target customer survey data to determine relative importance of different hotel attributes with part-worth utility analysis, to determine ideal hotel room features for each potential attribute with conjoint analysis, and to identify different customer segments with k-means clustering
- To recommend attributes for a new hotel with the highest likelihood of success, used segmentation and conjoint analysis data to conduct market analysis with competing brands and to identify ideal hotel features for each customer segment
- Technologies used:
R, Plotly, ggplot2
Page template forked from evanca